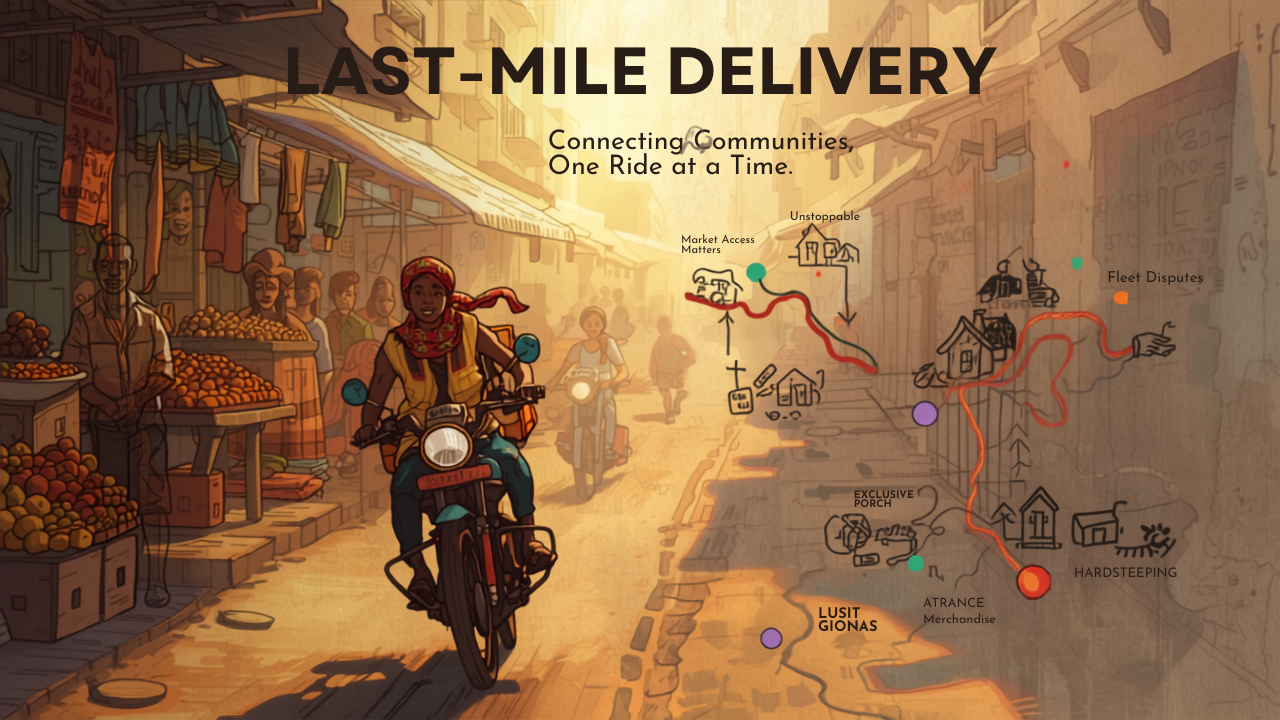
A pharmaceutical distributor in Lagos spent three months trying to implement a route optimization algorithm built for London. The algorithm assumed street addresses, traffic data, and delivery windows. Lagos has all three - just not in the formats the software expected. The project was eventually abandoned in favor of a hybrid approach: technology for dispatch and tracking, local knowledge for route planning.
That failure captures the core challenge of last-mile delivery optimization in emerging markets: generic solutions built for developed-market infrastructure frequently don't translate. What does translate - with adaptation - is the underlying logic of reducing cost per delivery while meeting customer expectations. Here's how to approach that problem systematically.
Why Last-Mile Costs Are So High
The "last mile" (in practice, often the last 50-100km) is expensive for compounding reasons:
- Volume fragmentation: One truck serving one hundred individual delivery points, rather than one factory or one port, multiplies stop-related time and costs.
- Failed deliveries: When recipients aren't home or addresses can't be located, the delivery must be re-attempted - doubling or tripling the cost of that shipment.
- Traffic and infrastructure: Urban congestion, road quality, and inadequate addressing systems increase time per delivery.
- Low density in rural areas: Long distances between delivery points in rural markets make cost per delivery high regardless of optimization.
- Reverse logistics: Returns and failed deliveries must be processed at additional cost.
Key Optimization Levers for Emerging Markets
1. Address Standardization and Geocoding
In markets where formal addresses don't exist - common in West Africa, parts of Southeast Asia, and rural Latin America - alternative location systems are increasingly viable. What3Words has divided the globe into 3m x 3m squares with unique three-word identifiers, enabling precise delivery addresses in communities with no street names. Google Plus Codes offer a similar capability. For B2C delivery in informal urban areas, GPS coordinates captured during customer onboarding (from a mobile app or WhatsApp interaction) are often more accurate than street addresses even when formal addresses exist.
2. Dynamic Route Optimization
Static route planning (fixed daily routes) is efficient for predictable delivery patterns but wastes capacity for variable demand. Dynamic route optimization algorithms re-plan routes daily based on actual order volume, traffic conditions, and vehicle availability. The algorithms require: accurate delivery locations (see above), reliable traffic data (a challenge in many emerging markets), and vehicle capacity inputs. When traffic data is limited, manual driver adjustments to algorithmic suggestions are necessary - treat the algorithm as a planning tool, not a mandate.
3. Hub-and-Spoke Network Design
Consolidating deliveries through intermediate hubs - city distribution centers that receive larger shipments and dispatch local delivery routes - reduces trunk-line costs while enabling efficient last-mile routing. The hub design must account for local logistics reality: hub locations that workers can reach reliably, receiving schedules that match local traffic patterns, and security for goods overnight if needed.
4. Crowdsourced and Agent Delivery Models
Asset-light delivery using local individuals (gig workers, agents, or community representatives) as delivery personnel has scaled significantly in emerging markets. Models include: gig platforms (similar to Lalamove or Glovo) that connect delivery requests to available drivers, local agent networks (kiosks, mobile money agents, small retailers) that receive deliveries for neighborhood pickup, and "last-mile agent" programs that employ local residents with local knowledge to execute final delivery.
5. Delivery Slot Management and Customer Communication
Failed first delivery attempts are extraordinarily expensive - often 60-80% of the original delivery cost for a re-attempt. Reducing failed delivery rates requires: confirmed delivery windows (customer acknowledges the expected time), real-time delivery notifications (SMS alerts as the driver approaches), easy rescheduling options, and alternative delivery locations (neighbor pickup, agent pickup). In markets with high mobile penetration, WhatsApp-based delivery notification and rescheduling can achieve significant first-attempt delivery rate improvement.
6. Proof of Delivery and Digital Confirmation
Paper-based delivery confirmation creates reconciliation delays, lost records, and disputes. Digital proof of delivery - photo confirmation, recipient signature on a mobile device, or OTP verification via SMS - creates an immediate, searchable record that reduces disputes and enables real-time performance tracking.
Last-Mile Delivery Frequently Asked Questions
What percentage of total shipping cost does last-mile delivery represent?
Last-mile delivery accounts for 53% of total shipping cost on average, according to Capgemini research - more than all upstream logistics combined. In markets with high failed delivery rates (common in emerging markets where addresses are informal), the actual cost is higher still because failed delivery attempts must be counted. This cost concentration is why last-mile optimization has the highest ROI of any logistics improvement initiative.
How do you track deliveries in areas without reliable street addresses?
Effective approaches: GPS coordinates captured during customer onboarding and stored in the delivery management system; What3Words or Google Plus Codes as alternative address formats; landmark-based descriptions in a structured format ("left turn at the blue gate, third house"); zone-based delivery where drivers are assigned geographic zones they know well enough to navigate from approximate addresses. Most successful operators in informal urban markets use a combination of technology (GPS on delivery vehicles) and local knowledge (experienced drivers in assigned zones).
What is a realistic first-attempt delivery success rate in emerging markets?
Best-in-class first-attempt delivery rates in emerging markets: 85-92% with strong customer communication and address verification. Industry average in many emerging markets: 65-75%. The gap between average and best-in-class is primarily driven by customer notification and re-scheduling workflows, not infrastructure quality. SMS confirmation and delivery window management produce the largest single improvement in first-attempt success rates.
How do you calculate cost per delivery and use it for optimization decisions?
Cost per delivery = total last-mile cost ÷ successful deliveries. Total last-mile cost includes: driver labor (or per-delivery payment for gig drivers), vehicle operating costs (fuel, maintenance, depreciation), technology platform fees, re-delivery costs, and failed delivery administrative costs. Compare cost per delivery against alternative models - your own fleet vs. outsourced gig drivers vs. agent network - to determine the most cost-effective mix for each delivery zone's density and order profile.
What technology stack is needed for last-mile delivery management in emerging markets?
Minimum viable stack: (1) Delivery management software for order dispatch, route generation, and driver assignment (options: Routific, OptimoRoute, Circuit, or regional platforms). (2) Driver mobile app with offline capability (essential in areas with inconsistent connectivity) for task receipt, navigation, and proof of delivery capture. (3) Customer notification system - SMS is more reliable than app notifications in markets with inconsistent smartphone penetration. (4) Tracking dashboard for operations team visibility into active deliveries. Total cost for a mid-scale operation: $300-1,500/month depending on delivery volume.
Key Takeaways
- Last-mile delivery accounts for 53% of total shipping cost but receives the least systematic optimization attention.
- Failed first delivery attempts cost 60-80% of the original delivery cost to re-attempt - customer communication is the highest-ROI fix.
- GPS coordinates and What3Words addresses outperform formal street addresses in informal urban markets across Africa and Southeast Asia.
- Best-in-class first-attempt delivery rates in emerging markets reach 85-92% through SMS confirmation and delivery window management.
- Cost per delivery and first-attempt success rate are the two KPIs that should drive every last-mile optimization decision.
Need full visibility from shipment origin to last-mile delivery? See how QueChains tracks the complete delivery journey end to end.
Written by the QueChains Editorial Team
Talk to our team about how QueChains can transform your supply chain operations.